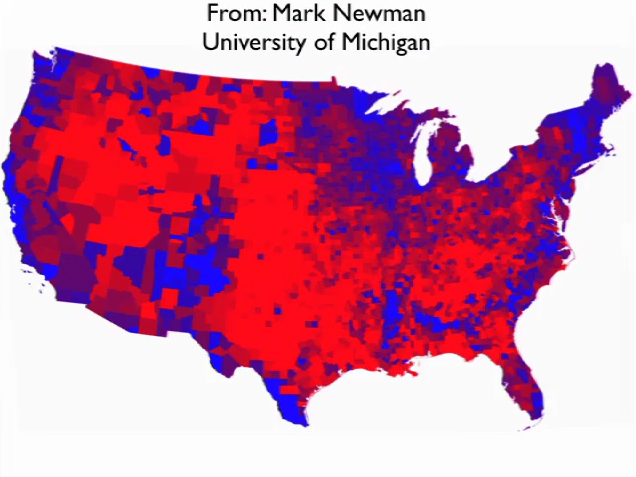
we can see in the Upper Mississippi River Valley as we go up into northern Illinois, Iowa up into Wisconsin area here
我們看到密西西比河谷北部 分別是被伊利諾伊州 愛(ài)荷華州 往北威斯康辛州
a real blue splotch that had been really purple real bluing here
連成一片藍(lán)色區(qū)域 這里過(guò)去是紫色的 如今藍(lán)色加深了不少
I'm pretty sure Wisconsin is the most county shift from the Republican to the Democratic category
我很確定威斯康辛州可能是有最多搖擺縣 從共和黨陣營(yíng)轉(zhuǎn)向民主黨的一個(gè)州
and we see a lot of familiar features
我們看到很多熟悉的特性
we see the Black Belt here, heavily African American zone, heavily African American in the
我們看到沃土地帶 是美籍黑人聚居的地方 同時(shí)他們還大量聚居在
it's called the Inland Delta of Mississippi, heavily African American in central South Carolina, north-eastern North Carolina
密西西比河的內(nèi)陸三角洲 以及南卡羅來(lái)納中部 北卡羅來(lái)納東北部
those are pretty typical patterns
這都是一些典型的選情分布

but we do have some changes, it's hard to see on this map
但其中也發(fā)生了一些變化 只是從這幅圖中不容易看出來(lái)
other maps will show it a little more clearly
其他地圖會(huì)表現(xiàn)得更清楚
I'd like to have that hanging on my wall
我很想把這幅地圖掛在我的墻上
I find it not just informative but just a beautiful pattern
它不僅表達(dá)了很多信息 而且還很有美感
my daughter thinks it looks like a butterfly
我女兒覺(jué)得它的形狀像只蝴蝶
but again just taking counties and distorting them to reflect population
它是根據(jù)縣級(jí)投票數(shù)按人口比例變形制成的
and actually he's done a better job of preserving geographical shape
事實(shí)上這幅地圖更好地保留和體現(xiàn)了地區(qū)的形狀
as you can see San Francisco is actually being able to keep the shape pretty well
例如你能從圖中認(rèn)出三藩市 它的形狀就保留得非常好
I'm sure some physicists
我想這些物理學(xué)家
I'm sure there's a very complicated algorithm
一定要通過(guò)非常復(fù)雜的算法計(jì)算
he's going into creating this map but he got it up in a day which was amazing to me
才能處理出這一幅地圖 但大選完一天后他們就完工了 我覺(jué)得很不可思議
we can see things like the Black Belt here stretched really thin
我們看到圖中的沃土地帶狹長(zhǎng)地延伸開(kāi)來(lái)
because those counties don't have a lot of people and a lot of them are losing population
這是因?yàn)檫@些縣人口較少 且他們的人口仍在繼續(xù)下降
we can see some big urban blobs again
我們看到一些大都市區(qū)形成的圓點(diǎn)
you can see Atlanta here
如亞特蘭大
blue area with some purple inner suburbs and then some very red outer suburbs, that's a very clear pattern
藍(lán)色的區(qū)域被紫色的內(nèi)城郊環(huán)繞 到外郊則變?yōu)槊黠@的紅色 這種變化模式非常明顯
we can see Washington DC Area much bluer than it had been
我們看到華盛頓特區(qū)的藍(lán)色比以前加深了很多
some of these red areas up in central Pennsylvania attenuated compared to how they had been before
賓夕法尼亞中部的紅色區(qū)域與之前的對(duì)比變小了
you'll see the Newman's juxtaposition
來(lái)把紐曼繪制的兩屆大選圖作個(gè)比較
here is 2004 versus 2008
這分別是04年和08年的圖
look at the Upper Mississippi River up here, a purple zone, now a pretty blue zone
看密西西比河上游地區(qū) 04年的紫色地帶變成了明顯的藍(lán)色
look in Arkansas and parts of Oklahoma where had been purple now much redder
看阿肯色還有俄克拉荷馬部分地區(qū) 從過(guò)去的紫色變?yōu)榱思t色
so actually losses to the Democratic side in the sort of greater lower Mississippi Valley whatever you want to call this region of the country
可見(jiàn)民主黨在密西西比河谷下游地區(qū)丟失了一些選票
you can see New England bluer
新英格蘭地區(qū)的藍(lán)色變深了
you can see a change in the coastal area here as well
東部沿海地區(qū)也更趨向藍(lán)色
and some changes in Florida
佛羅里達(dá)也發(fā)生了一些變化
some other maps will show that a little bit better
可能其他地圖會(huì)表現(xiàn)得更清楚
here just comparing these county cartograms
這里是縣級(jí)地圖變形后的對(duì)比


