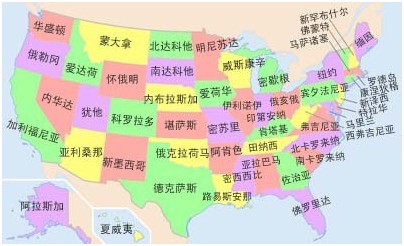
What else? how about income?
還有什么其他因素影響選民的投票傾向?收入?
We've started talk about income
我們之前談過一點收入的影響
So let me continue with that and here's we get really interesting
現(xiàn)在繼續(xù)討論一下,研究這個話題是很有意思的
Because the paradox we'll see in a second
因為很快我們就會發(fā)現(xiàn)一些很矛盾的現(xiàn)象
We just take household income 2006 median household income
我們對06年的家庭收入中位數(shù)進行分析
The green states here, the wealthier states
圖中的綠色州較為富裕
The yellow states the poor states
黃色州較為貧窮
And we see good but imperfect correlation with our "red blue voting" pattern
我們看到圖中的顏色分布規(guī)律與紅藍選情相似但也有一些差異
We see the wealthiest part of the country from New Hampshire,
我們從圖中可以看到美國最富裕的州,新罕布什爾,
Massachusetts Connecticut, New Jersey, Maryland very clear pattern here
馬薩諸塞 康涅狄格,新澤西,以及馬里蘭,我們在圖中看得非常清楚
And that's very strong Democratic voting area
這些富裕區(qū)域是民主黨的忠實支持者
We see the upper great lakes some relatively wealthy states like Illinois and Minnesota
我們看到在大湖區(qū)有較為富裕的伊利諾伊和明尼蘇達
We see in the Pacific coast some relatively well-off states like California and Washington
在太平洋沿岸有較為富裕的加州和華盛頓州
But then we also have some exceptional patterns
但也有一些比較例外的情況
We find Utah which is one of the wealthier states
猶他是最為富裕的州之一
And one of the most Republican voting states
但它是共和黨最忠實的支持者之一
By sometimes the most Republican voting states
有時候是最忠實的
What is interesting though,
有趣的是
this is household income it comes out differently if you do per capita
我們現(xiàn)在看到是家庭收入,從人均收入的角度觀察,情況會大有不同
Utah will be much lower in per capita
猶他州的人均收入較之家庭收入低得多
because Utah has large families and high fatality rate
因為猶他州有很多大家族而且死亡率很高
So what you choose to map can lead to very different patterns
因此根據(jù)不同數(shù)據(jù)繪制出的地圖顯示出的結(jié)果也大相徑庭

What do we see here
我們還能發(fā)現(xiàn)什么?
How good is the correlation
收入和投票傾向關(guān)聯(lián)如何
We can see a relatively poor area in the northern plains
我們看見北部平原地區(qū)相對貧窮
North Dakota, South Dakota and Montana, yes Republican voting
如北達科他,南達科他和蒙大拿,沒錯,它們都支持共和黨
A poor area across most of the south with Virginia be quite an exception
貧窮區(qū)域貫穿美國南部但弗吉尼亞是個例外
Georgia, Florida and Texas exceptional as well
喬治亞,佛羅里達,德州也是例外
And that correlations are fairly closely but again, imperfectly
可見人均收入與投票傾向關(guān)系密切,但這種關(guān)系也不是絕對的
Arizona, another Republican voting state relatively well-off as well
例如亞利桑那州,另一個支持共和黨的州是一個相對富裕的州
We can look at some other ways of doing this
我們還可以通過另一種方式進行比較
Take the wealthiest states in the country by again median household income
選出最富裕的幾個州,按家庭收入的多少進行排列
Look at the percentage of people voting for Kerry and what do we see
并對比這幾個州中選民對克里的支持率,你發(fā)現(xiàn)了什么
Well, New Jersey 53%, Maryland 56%, Hawaii 54% Connecticut 54% and so on
他的支持率分別為: 新澤西53%、馬里蘭56% 、夏威夷54%、康涅狄格54%
We don't really get an exception until we hit Alaska
阿拉斯加是第一個沒選民主黨的富裕州
Which has a relatively wealthy state
這是一個相對富裕的州,
although also a very expensive state to live in
該州居住成本很高
With a very Republican voting pattern
同時也是一個忠實的共和黨支持者
And then Utah, we hit it again with even more Republican voting pattern
然后我們看到猶他州,又一個例外,該州是一個更為忠實的共和黨支持者
Virginia 45% although we'll talk about later
弗吉尼亞45%,稍后我們會討論討論它的情況
Virginia now is trending to Democrats about the same margin
現(xiàn)在大選中民主黨在弗吉尼亞的支持率約為55%
So there can be a shift
因此今年它也許會轉(zhuǎn)而支持民主黨
I don't know how about anyone when I saw this
不知道你是否也有同感,當我看到這幅圖時
I was surprised California came as low as it did that surprises anyone?
我對加州的家庭收入之低感到驚訝有人和我一樣感到奇怪嗎?
Here's the answer
讓我來告訴你原因
States with high and low income inequality
這幅地圖反映了各州的收入差距
The darker the state the higher the income inequality
顏色越深的州,收入不平等越顯著
And California is off the charts there
加州的不平等明顯比其他州嚴重


